
Home price appreciation continues to accelerate. Today, prices are driven by the simple concept of supply and demand. Pricing of any item is determined by how many items are available compared to how many people want to buy that item. As a result, the strong year-over-year home price appreciation is simple to explain. The demand for housing is up while the supply of homes for sale hovers at historic lows.
Let’s use three maps to show how this theory continues to affect the residential real estate market.
Map #1 – State-by-state price appreciation reported by the Federal Housing Finance Agency (FHFA) for the first quarter of 2021 compared to the first quarter of 2020: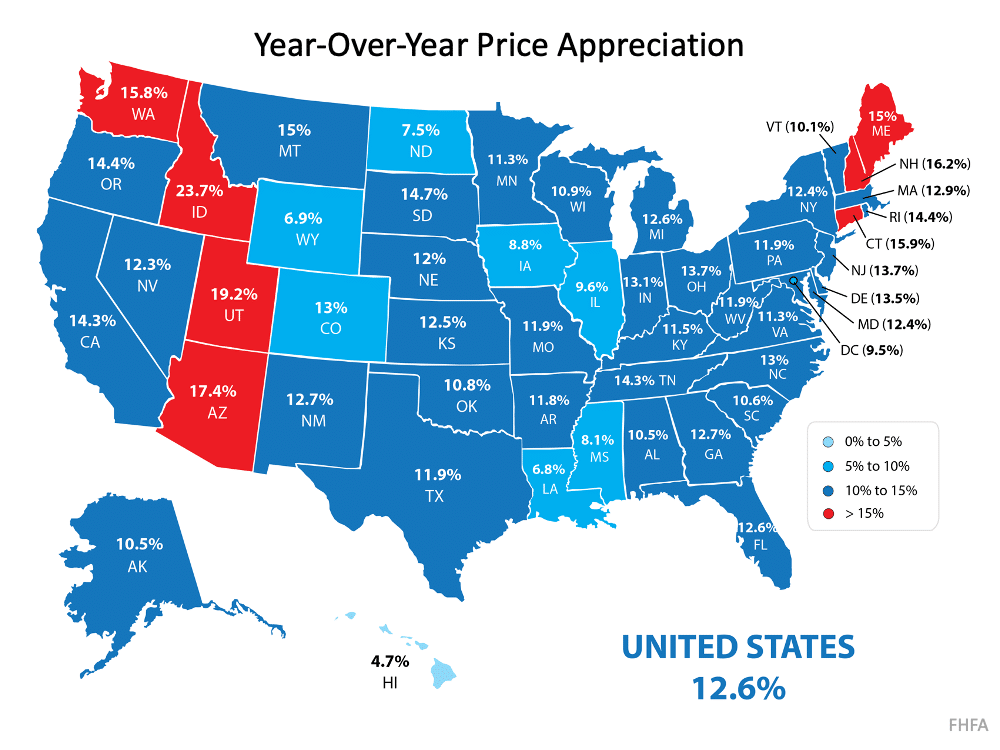 As the map shows, certain states (colored in red) have appreciated well above the national average of 12.6%.
Map #2 – The change in state-by-state inventory levels year-over-year reported by realtor.com: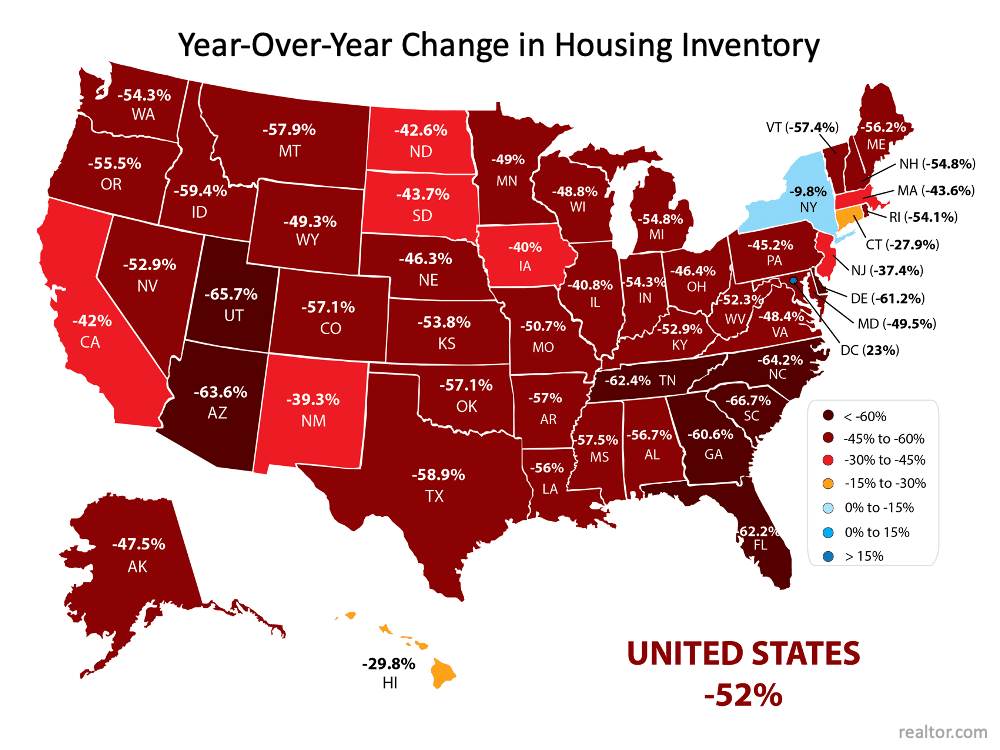 Comparing the two maps shows a correlation between change in listing inventory and price appreciation in many states. The best examples are Idaho, Utah, and Arizona. Though the correlation is not as easy to see in every state, the overall picture is one of causation.
The reason prices continue to accelerate is that housing inventory is still at all-time lows while demand remains high. However, this may be changing.
Is there relief around the corner?
The report by realtor.com also shows the monthly change in inventory for each state.
Map #3 – State-by-state changes in inventory levels month-over-month reported by realtor.com: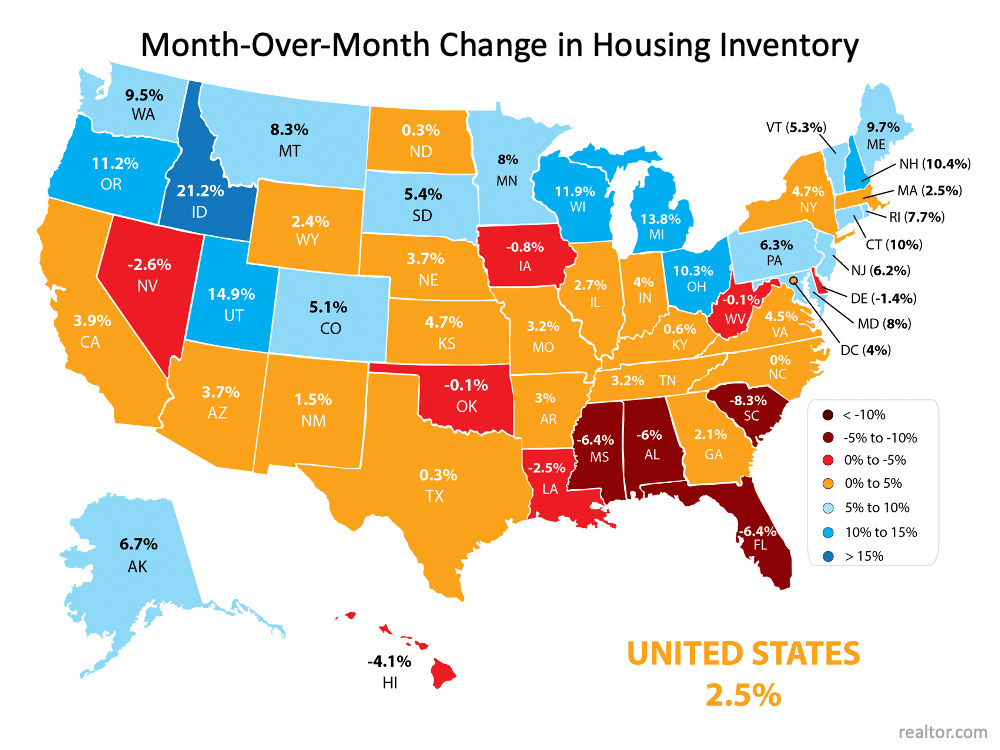 As the map indicates, 39 of the 50 states (plus the District of Columbia) saw increases in inventory over the last month. This may be evidence that homeowners who have been afraid to let buyers in their homes during the pandemic are now putting their houses on the market.
We’ll know for certain as we move through the rest of the year.
Bottom Line
Some are concerned by the rapid price appreciation we’ve experienced over the last year. The maps above show that the increases were warranted based on great demand and limited supply. Going forward, if the number of homes for sale better aligns with demand, price appreciation will moderate to more historical levels.
GIVE ME A CALL AND LETS TALK ABOUT YOUR REAL ESTATE NEEDS – JAMES JESTES 386-315-4744
Most Recent MLS Listings Today


Check out some of these most popular home searches here at Daytona Beach Property Search
- Homes for sale on the Intercoastal waterway
- Homes and Condos for sale with Seller Financing Available
- Homes for sale in Port Orange along Spruce Creek Rd
- Port Orange Homes for sale with Boat Docks
- New Construction Town Homes in Plantation Bay
- Homes For Sale in LPGA
- Homes For Sale in the Spruce Creek High School District ( TOP RATED SCHOOLS)
SEARCH ALL HOMES IN THE GREATER DAYTONA BEACH AREA HERE
[idx-omnibar styles=”1″ extra=”1″ min_price=”1″ ]
DOWNLOAD MY LATEST REAL ESTATE GUIDES


