Daytona Beach Property Search

Buy Or Sell With James Jestes and eXp Realty

  • Menu
  • Home
  • Buy
  • Sell Your Home
  • Blog
  • About
  • Contact

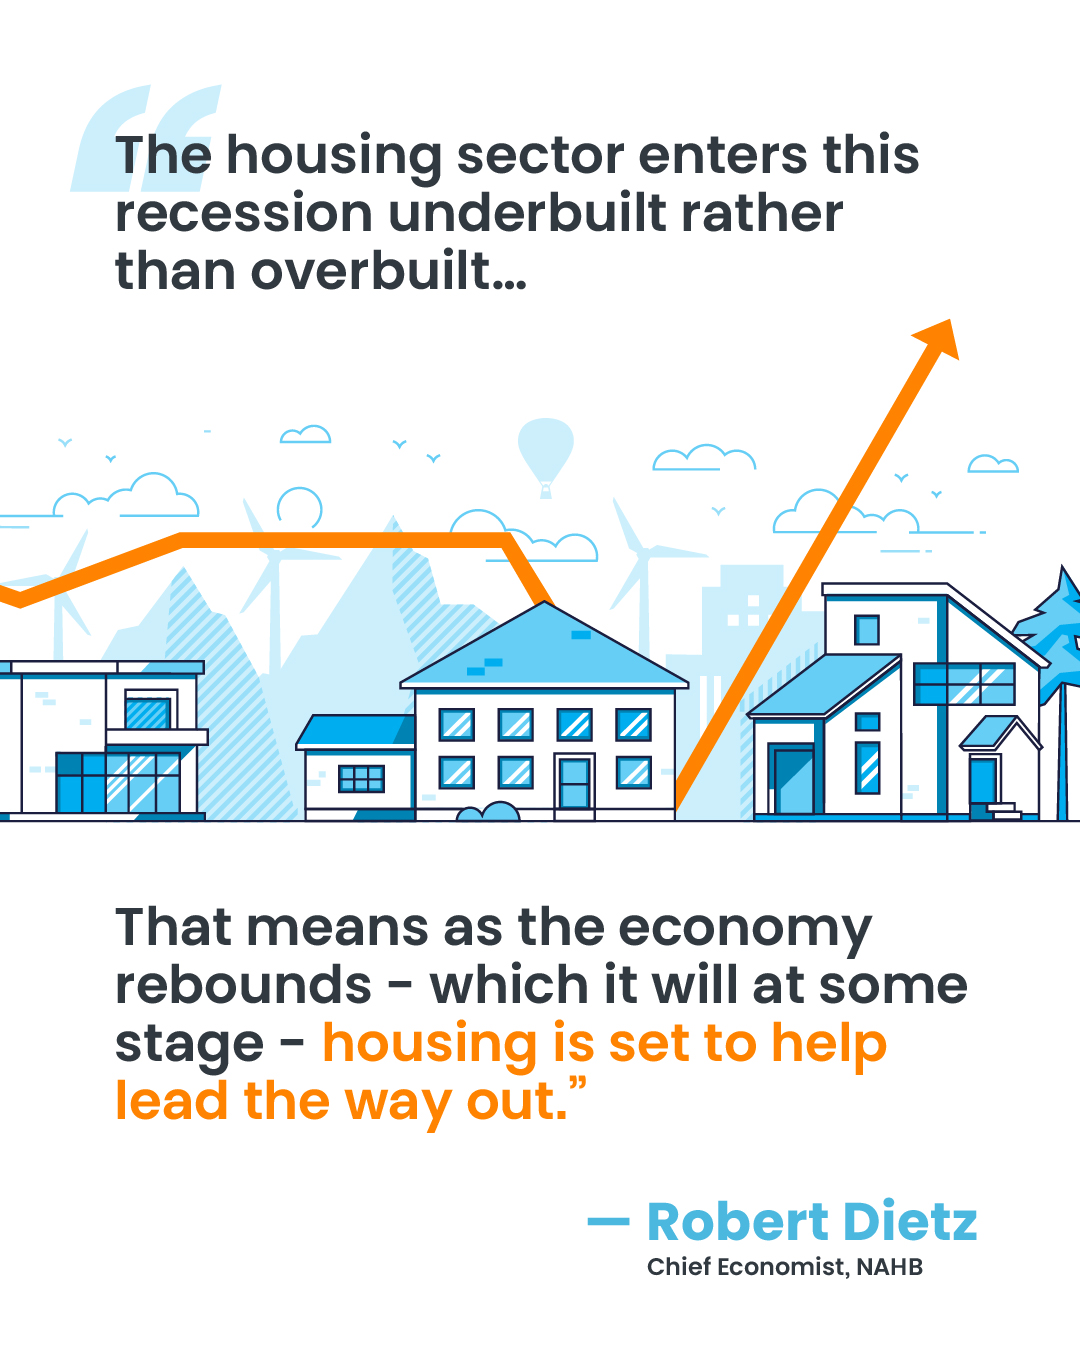
The Housing Market Is Positioned to Help the Economy Recover [INFOGRAPHIC]


The Housing Market Is Positioned to Help the Economy Recover | Simplifying The Market

Some Highlights

  • Expert insights are painting a bright future for housing when the economy bounces back – and it will.
  • We may be facing challenging economic times today, but the housing market is poised to help the economy recover, not drag it down.
  • Let’s connect to make sure you’re informed and ready when it’s time to make your move.

Continue reading…

Posted in: Blog, For Buyers, For Sellers, Housing Market Updates, Infographics

What You Can Do to Keep Your Dream of Homeownership Moving Forward [INFOGRAPHIC]

What You Can Do to Keep Your Dream of Homeownership Moving Forward [INFOGRAPHIC] | Simplifying The Market

What You Can Do to Keep Your Dream of Homeownership Moving Forward [INFOGRAPHIC] | Simplifying The Market

Some Highlights:

  • Don’t put your homeownership plans on hold just because you’re stuck inside.
  • There are several things you can do right now to keep your home search moving forward.
  • Connect with an agent, learn about resource programs for things like down payments, and get pre-approved today.

Continue reading…

Posted in: Blog, Down Payments, First Time Home Buyers, For Buyers, Infographics, Move-Up Buyers

The Difference an Hour Makes


The Difference an Hour Makes [INFOGRAPHIC] | Simplifying The Market

Some Highlights:

  • Don’t forget to set your clocks forward this Sunday, March 8 at 2:00 AM EST in observance of Daylight Saving Time, unless you’re a resident of Arizona or Hawaii!
  • Every hour in the United States, 568 homes are sold and median home values rise by $1.92.
  • As we “spring forward” this year, let’s get together to see how you can take advantage of every hour in the housing market.

Continue reading…

Posted in: Blog, For Buyers, For Sellers, Infographics

Interest Rates Over Time

Interest Rates Over Time [INFOGRAPHIC] | Simplifying The Market

Some Highlights:

  • With interest rates hovering at near historic lows, now is a great time to look back at where they’ve been, and how much they’ve changed over time.
  • According to Freddie Mac, mortgage interest rates are currently hovering near a five-decade low.
  • The impact your interest rate has on your monthly mortgage payment is significant. An increase of just $20 dollars in your monthly payment can add up to $240 per year or $7,200 over the life of your loan. Maybe it’s time to lock in now while rates are still low.

Right now you have some of the best buying power possible with these historically low interest rates. You are practically purchasing the home with Free money! Your able to buy a lot more home with the same monthly payments you would have had just a a few years ago.  You dont have to imagine what you could buy, just take a look at some of these homes!

Continue reading…

Posted in: Blog, For Buyers, Infographics, Interest Rates

Reasons to Fall in Love with Homeownership [INFOGRAPHIC]

Top Reasons to Love Homeownership [INFOGRAPHIC] | Simplifying The Market

Top Reasons to Love Homeownership [INFOGRAPHIC] | Simplifying The Market

Some Highlights:

  • There are many benefits to love about homeownership, and they’re not all financial.
  • Being a part of a neighborhood, driving academic achievement, and improving mental health are just a few of these advantages.
  • Let’s get together today to determine if you’re ready to embrace the rewards of owning your own home.

Continue reading…

Posted in: Blog, First Time Home Buyers, For Buyers, Infographics

The Top States Americans Moved to Last Year [INFOGRAPHIC]

The Top States Americans Moved to Last Year [INFOGRAPHIC] | Simplifying The Market

The Top States Americans Moved to Last Year [INFOGRAPHIC] | Simplifying The Market

Some Highlights:

  • Americans are on the move, and the most recent Atlas Van Lines Migration Patterns Survey tracked the 2019 traffic flow from state-to-state.
  • Idaho held on to the top spot of ‘high inbound’ states for the second time since 2017, followed by Washington State.
  • New York was the country’s outbound move leader in 2019, a designation it most recently held in 2014.

Continue reading…

Posted in: Blog, For Buyers, For Sellers, Infographics

5 Reasons Homeowners Throw Better Parties During the Big Game [INFOGRAPHIC]

5 Reasons Homeowners Throw Better Parties During the Big Game [INFOGRAPHIC] | Simplifying The Market

5 Reasons Homeowners Throw Better Parties During the Big Game [INFOGRAPHIC] | Simplifying The Market

Some Highlights:

  • There’s more room to entertain a large crowd.
  • The kitchen is big enough to whip up endless appetizers – yum!
  • You don’t have to worry about complaints to your landlord when the cheering kicks in!

Continue reading…

Posted in: Blog, First Time Home Buyers, For Buyers, Infographics, Rent vs. Buy

2020 Homebuying Checklist


2020 Homebuying Checklist | Simplifying The Market

Some Highlights:

  • If you’re thinking of buying a home, plan ahead and stay on the right track, starting with pre-approval.
  • Being proactive about the homebuying process will help set you up for success in each step.
  • Make sure to work with a trusted real estate professional along the way, to help guide you through the homebuying steps specific to your area.

Continue reading…

Posted in: Blog, For Buyers, Infographics

Where Homebuyers Are Heading By Generation [INFOGRAPHIC]

Where Homebuyers Are Heading By Generation [INFOGRAPHIC] | Simplifying The Market

Where Homebuyers Are Heading By Generation [INFOGRAPHIC] | Simplifying The Market

Some Highlights:

  • Whether capitalizing on job opportunities, affordability, or warm-weather places to retire, Americans are making moves to these top cities to take advantage of the strength in the current housing market.
  • A strong economy and lower mortgage rates have made it easier for many would-be buyers to get into the market. According to realtor.com, it just depends on which market.
  • To find the top market in our area, let’s get together.

Continue reading…

Posted in: Baby Boomers, Blog, Demographics, For Buyers, For Sellers, Generation X, Infographics, Millennials, Pricing

National Cut Your Energy Costs Day [INFOGRAPHIC]


National Cut Your Energy Costs Day [INFOGRAPHIC] | Simplifying The Market

Some Highlights:

  • On January 10th of each year, “National Cut Your Energy Costs Day” encourages consumers to reduce their overall energy costs by improving home efficiency.
  • According to Freddie Mac, a typical U.S. family spends $2,200 per year on energy bills. By making energy efficient upgrades, you could reduce your energy bills by up to 30%.
  • To assess the energy efficiency of your home and see how it measures up, take a moment to check out Home Energy Yardstick to calculate your estimated opportunity. Don’t forget to have your energy bills nearby!

Continue reading…

Posted in: Blog, For Sellers, Infographics

Posts navigation

  • « Previous Page
  • 1
  • …
  • 20
  • 21
  • 22
  • 23
  • 24
  • …
  • 27
  • Next Page »