![Buyers Are Looking For Your Home [INFOGRAPHIC] | Simplifying The Market](https://daytonabeachpropertysearch.com/wp-content/uploads/2019/11/20191129-KCM-Share-549x300.jpg)
![Buyers Are Looking For Your Home [INFOGRAPHIC] | Simplifying The Market](https://daytonabeachpropertysearch.com/wp-content/uploads/2019/11/20191129-MEM-ENG-scaled.jpg)
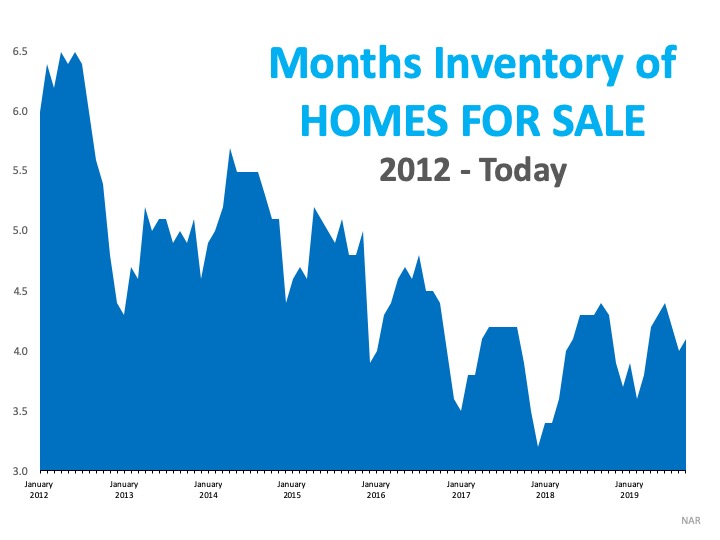
Some Highlights:
- Existing Home Sales are currently at an annual pace of 5.46 million.
- The inventory of existing homes for sale remains below the 6 months needed for a normal market and is now at a 3.9-month supply.
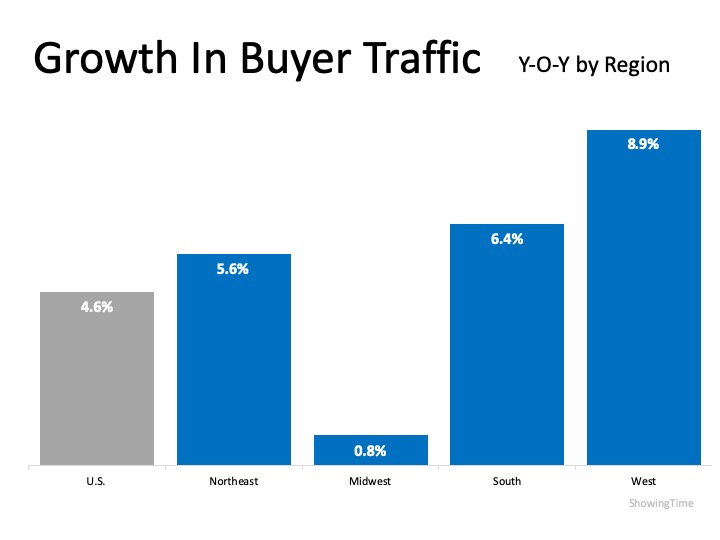
- Inventory remains low due to high demand from buyers who are still looking for a house to buy!

![The Cost of Renting vs. Buying a Home [INFOGRAPHIC] | Simplifying The Market](https://daytonabeachpropertysearch.com/wp-content/uploads/2019/11/20191115-KCM-Share-549x300.jpg)
![The Cost of Renting vs. Buying a Home [INFOGRAPHIC] | Simplifying The Market](https://daytonabeachpropertysearch.com/wp-content/uploads/2019/11/20191115-MEM-ENG.jpg)


![The Difference an Hour Will Make This Fall [INFOGRAPHIC] | Simplifying The Market](https://daytonabeachpropertysearch.com/wp-content/uploads/2019/11/20191101-MEM.jpg)

![Homes Are Selling Quickly [INFOGRAPHIC] | Simplifying The Market](https://daytonabeachpropertysearch.com/wp-content/uploads/2019/10/20191018-KCM-Share-549x300.jpg)
![Homes Are Selling Quickly [INFOGRAPHIC] | Simplifying The Market](https://daytonabeachpropertysearch.com/wp-content/uploads/2019/10/20191018-MEM-1.jpg)